
Here's where moose and deer find their food – SLU releases unique map
For the first time, there is now a map showing where the forage for deer and moose is located. The maps, produced by researchers at SLU, shows where key tree species for ungulates are found and how much is at grazing height.
The hope is that the map will contribute to the efforts to reduce forest damage and at the same time preserve the wildlife population.
- Moose and deer like to graze on young trees, which can lead to costs for forest owners. The extent of the damage depends, among other things, on how much forage there is in the area. This is something we now get a better overview of thanks to the new forage map, says Lukas Graf, doctoral student at SLU Forest Damage Centre's research school and the Department of Forest Sciences.
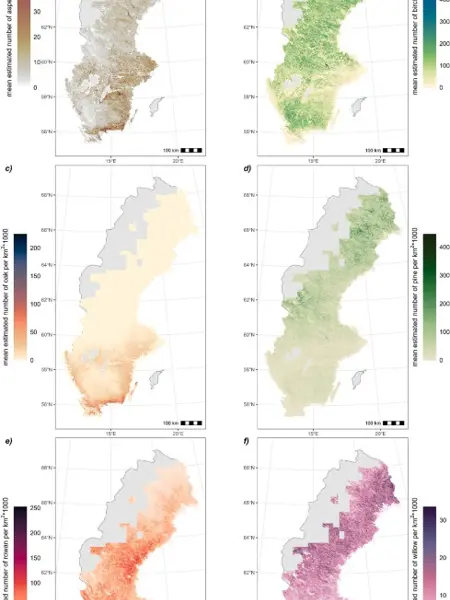
The map is based on data from the National Forest Inventory, together with information about forest structure, climate and land use. Remote sensing and laser scanning from aircraft have enabled researchers to estimate where small trees are located beneath the crowns of taller trees, thereby creating a national map of food availability. The researchers have mapped six tree species that are considered important for ungulates: pine, birch, aspen, rowan, oak and willow.
- The forest is a place where the interests and needs of forestry, hunting and biodiversity need to be balanced, which can be challenging. We hope that this map will help decision-makers and managers to plan sustainably, for example, in hunting or forage creating activities in moose management areas, says Lukas Graf.
This is the first map product in Sweden with a special focus on wildlife management. The researchers hope that it will contribute to an understanding of the foraging landscape for moose and other deer species.
The map contains six different layers, one per tree species, illustrating where small trees within browsing height are located, and the availability of each tree species can be easily read using layer colour, with a darker shade indicating higher estimated availability.
With a scale of 1 km2 and 1 hectare, the map shows differences in forage availability across the country. It is available via the Swedish National Data Service (SND) and supplements the Swedish Forest Agency's information on how many hectares of young forest within the so-called browsing window (0.5 m-4 m high trees) that exists within each moose management area. Together this provides a more comprehensive and detailed picture of the forage supply in the forest landscape.
Part of a larger initiative
The study is part of a broader effort to understand the relationship between forage availability and browsing damage in Swedish production forests.
- In the long term, we hope that the knowledge provided by the map can contribute to the ongoing efforts to reduce browsing damage in the forest, while preserving both wildlife populations and ecosystems, says Lukas.
Links
You find the dataset for the maps here.
You find the publication here: Mapping cervid forage in Sweden using remote sensing and national forest inventory data
Contact
-
Person
-
Person
-
PersonTheres Svensson, CommunicatorFaculty of Forest Sciences