The Swedish national environmental monitoring program for pesticides started in 2002 with the aim to track long-term trends in agricultural surface water and ground water quality, as well as to determine the occurrence of pesticides in sediment, air and precipitation.
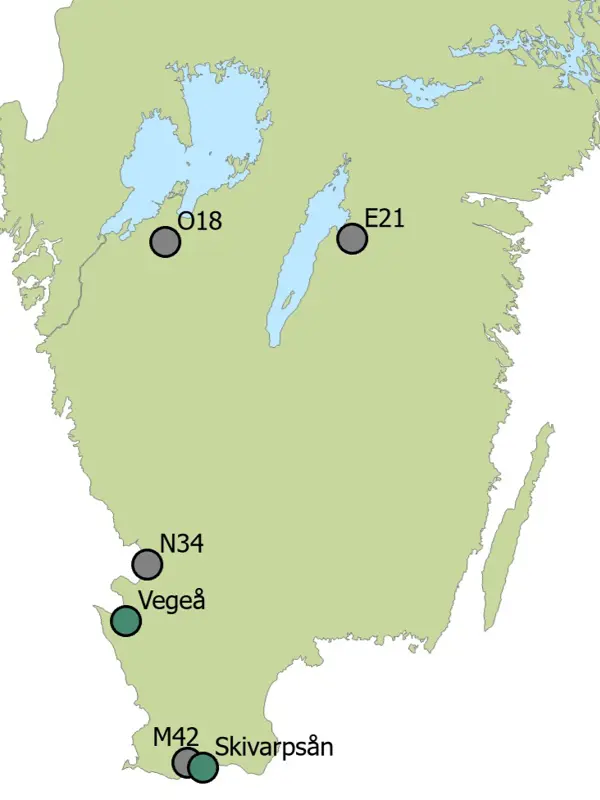
Map of surface water sampling sites within the Swedish national monitoring program of pesticides
Sampling locations
The environmental monitoring of pesticides is conducted primarily in four small catchments (8-16 km2) in agricultural regions in Sweden: in Skåne (M42), Halland (N34), Östergötland (E21) and Västra Götaland (O18). The areas are referred to model catchments (typområden in Swedish) and comprise of ca 90 % arable land. Within each model catchment, surface water and sediments are sampled within the stream that drains the area, and groundwater is sampled from 3-6 meters depth. The farmers within the model catchments are interviewed each year to collect information about the crops that are being grown and which pesticides are being used. The reported pesticide usage is compared to the pesticide occurrences detected in the surface water that drains the area.
The environmental monitoring program also includes surface water and sediment sampling in two larger streams/rivers in Skåne (Skivarpsån and Vege å, with catchments of 102 and 488 km2, respectively).
Pesticides in precipitation (since 2002) and air (since 2009) are collected at Söderåsen in Skåne (Vavihill/Hallahus). Since 2009, precipitation has also been collected at Aspvreten, south of Stockholm, but replaced by Norunda, north of Uppsala, in 2017.
Extent of sampling
Sampling of surface water in the model catchments is automated, by ISCO-samplers that are programmed to take a subsample every 90 minutes. Subsamples are combined into weekly samples that show which pesticides have passed through the sampling station and what their average concentration was during the week, so called weekly time integrated sampling. These samples are collected from April/May to October, the period when most pesticide applications are done in Swedish agriculture. For the model catchments in Skåne and Halland the sampling continues throughout the year, but with less frequent subsampling and composite samples taken out every two weeks. These samples are collected to examine if pesticides are leached from arable land during the winter months.
In the catchment M42 (Skåne) surface water a limited number of flow proportional samples are collected each summer.
Surface water samples from the larger streams/rivers are collected as grab samples by submerging bottles into the stream once or twice per month between May and October.
Sediment samples are collected annualy from the model catchments and the two rivers. Before 2021 sediment was collected as a single grab sample in September but the method changed to a sediment trap submerged in the water during May to October.
Groundwater samples are collected four times per year from two sites per catchment.
Precipitation samples are collected regularly after precipitation events between April and October in Vavihill/Hallahus (Söderåsen) and May to September in Norunda (previously in Aspvreten). In total 10-15 precipitation samples are collected for each location and year.
Around 10 air samples are collected annually at Vavihill/Hallahus by sampling devices that actively pump air through a filter and an adsorbent (PUF).
Pesticide analyses
Since 2002, the number of pesticides (mainly plant protection products) included in the analyses of water samples has increased from just under 80 to around 160 substances per sample (Figure a). This increase is partly due to new substances being approved on the market and therefore added to the analyses. At the same time, certain substances have been removed from the analyses, primarily because they are no longer detected in the samples. In total, 196 substances have been included in the analyses during some period. Sediment and air samples are analysed for slightly fewer substances.
The ambition of the analysis program is to have a list of substances which is up-to-date and reflects current use of plant protection products, hence new substances approved for the Swedish market are added to the list of substances analysed. At the same time, substances that are no longer approved for use, nor applied, may be kept in the analysis program because they are still detected in the samples. This is because some substances take longer time to degrade and/or leave the environment.
Substances are prioritized based on specific criteria, including which crops they are used on and national sales data. Priority is also given to substances used over large areas or in large quantities in the monitoring areas. Additionally, substances with low water quality objective values (i.e. highly toxic), high mobility (weak binding to soil particles and thus a higher risk of transport to surface and groundwater, Kfoc), and long half-lives (slow degradation, DT50) are given higher priority. In recent years, there has been an increasing focus on including transformation products.
The development of new methods and increasingly advanced instruments has made it possible to measure substances at ever-lower concentrations (Figure b). The most significant change occurred from the 2009 analyses onward, when a completely new method was introduced. This means that the increase in the number of detected substances in some cases reflects improved detection capabilities, and not necessarily an actual increase in the number of substances in the samples.
All analyses of plant protection products have been conducted by the laboratory for organic environmental chemistry (OMK) at the Department of Aquatic Sciences and Assessment, SLU. The analytical methods for water are accredited by SWEDAC, and the laboratory regularly participates in international intercalibration exercises. Water samples are analysed as whole water samples, meaning that both the particle-bound and dissolved fractions of the substances are included in the concentration determination. The laboratory is also accredited to report so-called trace levels (levels below the quantification limit but above the detection limit), which are therefore included in the presentation of results.
Figure b. Median of detection limits per type of pesticides in water samples (surface, ground, precipitation) from the Swedish environmental monitoring program of pesticides, 2002-2024.Figure 1a. Number of analysed substances per type of pesticide in water samples (surface, ground, precipitation) from the Swedish environmental monitoring program of pesticides, 2002-2024.
Data and results
The monitoring program is funded by the Swedish Environmental Protection Agency (Naturvårdsverket). Data are annually summaried in a number of figures on this site and data are free to down load from the data host (Jordbruksvatten).