Model catchments - crops and pesticide use

Page reviewed:  12/06/2025

Farmers in the catchments are interviewed annually about their cropping practices and use of plant protection products. This is done to determine which substances should be included in the analyses and to compare the substances detected in water with those that are actually used.

Crops

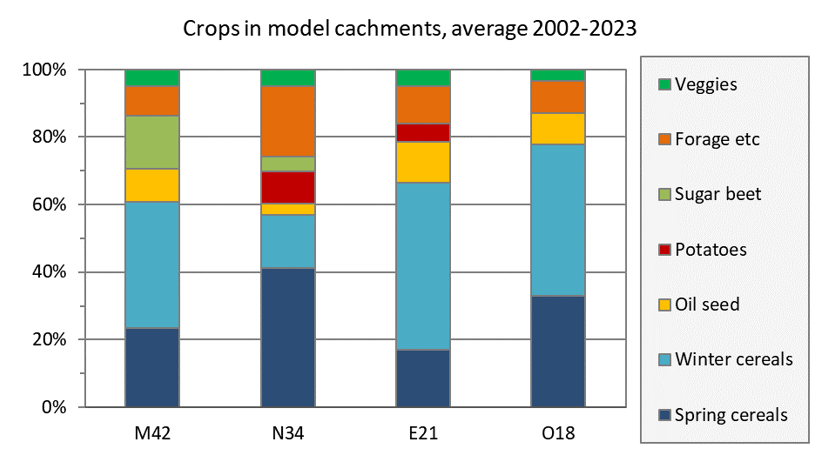
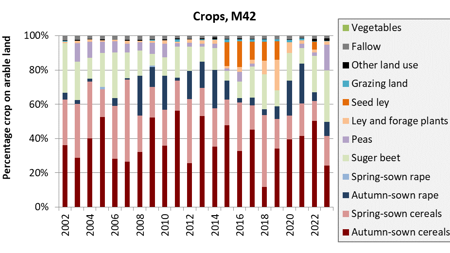
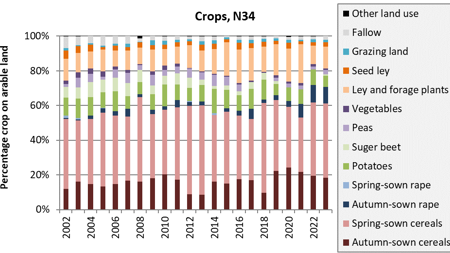
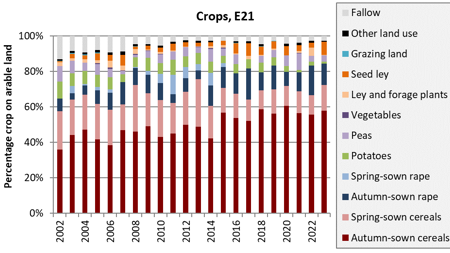
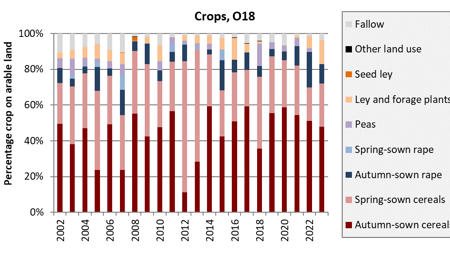
All four catchments are dominated by cereal production, along with smaller areas of oilseed crops. Potatoes are grown in the Halland (N34) and Östergötland (E21) areas, while sugar beets are grown in Halland (N34) and Skåne (M42). Grassland (forage) is most prevalent in the Halland area (N34). In addition, maize and legumes are cultivated for fodder production, along with peas, which in some cases are grown for food consumption. Some of the catchment areas also have smaller cultivated areas with crops such as onions, carrots, and strawberries.

Four barplots with a colour each per type of crop.
Barplot showing average procentage of area used to the different types of crops grown 2002-2023 per model catchment.
Stacked bar plot with one color each per type of crop.
Several different types of crops are grown in the model catchment in Skåne county (M42). Percentage of each crop of the total arable land of the catchment during 2002-2023 is shown in the barplot.
Stacked bar plot with one color each per type of crop.
Several different types of crops are grown in the model catchment in Halland county (N34). Percentage of each crop of the total arable land of the catchment during 2002-2023 is shown in the barplot.
Stacked bar plot with one color each per type of crop.
Several different types of crops are grown in the model catchment in Östergötland county (E21). Percentage of each crop of the total arable land of the catchment during 2002-2023 is shown in the barplot.
Stacked bar plot with one color each per type of crop.
Several different types of crops are grown in the model catchment in Västergötland county (O18). Percentage of each crop of the total arable land of the catchment during 2002-2023 is shown in the barplot.


Pesticide use

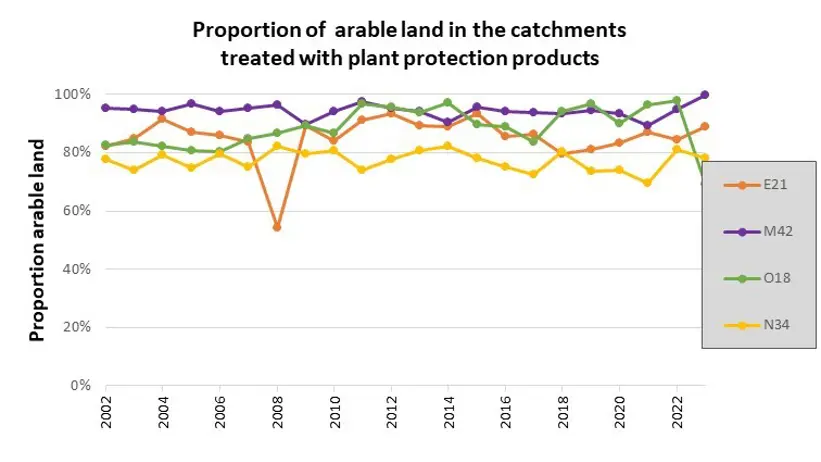
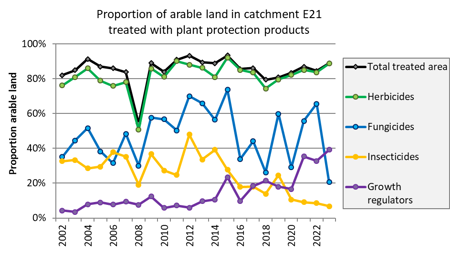
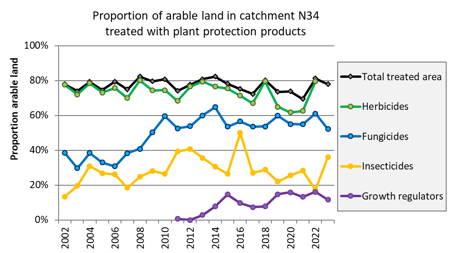
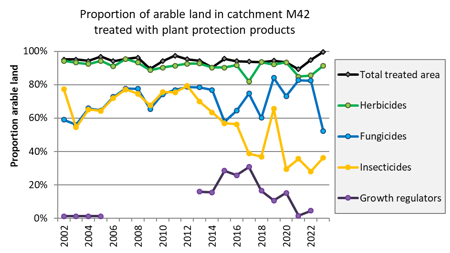
In the model catchments of Halland (N34) and Skåne (M42) counties there has been a greater use of pesticides throughout the period 2002-2024 than in the two more northern model catchments of Västergötland (O18) and Östergötland (E21) counties. This can partly be explained by a longer growing season in the southern counties, but also partly other crops and to a certain extent a greater need for pest control. Overall, the annual variation, mainly in M42 and N34, in terms of the amount of plant protection product used per hectare, makes it difficult to see any trend.

Line plot showing the proportion of arable land in the catchments treated with plant protection products between 2002 and 2023, one line per catchment
Percentage of arable land in the catchments treated with plant protection products between 2002 and 2023.
Line plot of different types of plant protection products: herbicides green, fungicides blue, insecticides yellow, growth regulators purple.
Percentage of areable land treated with different types of plant protection products in catchment E21 between 2002-2023.
Line plot of different types of plant protection products: herbicides green, fungicides blue, insecticides yellow, growth regulators purple.
Percentage of areable land treated with different types of plant protection products in catchment O18 between 2002 and 2023.
Line plot of different types of plant protection products: herbicides green, fungicides blue, insecticides yellow, growth regulators purple.
Percentage of areable land treated with different types of plant protection products in catchment N34 between 2002-2023.
Line plot of different types of plant protection products: herbicides green, fungicides blue, insecticides yellow, growth regulators purple.
Percentage of areable land treated with different types of plant protection products in catchment M42 between 2002-2023.