
Field inventories of deciduous forests and grasslands
The methodology uses two-stage sampling: aerial image classification of all plots, followed by field inventory of randomly selected plots. Joint inventory of deciduous forest and grassland creates synergies, as many areas contain both.
To inventory both common and uncommon habitats within a general framework, a comprehensive sampling design has been developed for NILS inventories of alpine areas, grasslands, seashores, and deciduous forests. It is essentially a multi-stage sampling design that is customized for each specific inventory. The inventories, in particular the grassland and deciduous forest inventories, are closely interconnected due to the significant synergy between them.
The aim of conducting field inventory
The aim of conducting a field inventory is to gather data that cannot be acquired through remote sensing, such as the definitive classification of natural types, quality of the habitat, and species occurrences.
Which plots are inventoried in the field?
Each tract consists of 196 circular plots. Only those sample plots that contain focal grasslands or deciduous forests can be selected for a inventory in the field. If there are many sample plots within the area that potentially contain the sought-after natural types, a random selection is made.
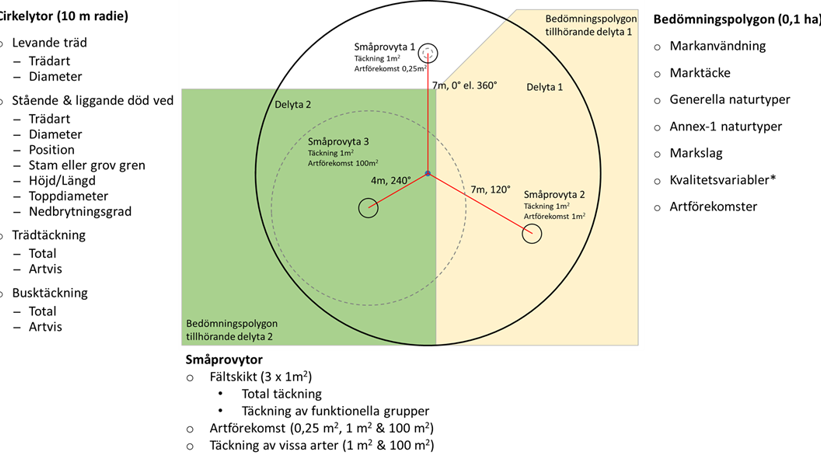
Figure 1. Sample plot sizes and variables included in the inventories.
Plots and variables
Each area consists of 196 circular sample plots with a radius of 10 meters. Within each sample plot, there are three subplots and one 0.1-hectare assessment polygon. Within the plots on variables such as, natural types (including Annex I natural types included in the Habitat Directive), ground cover, land use, quality variables, vegetation, and species.
Training and support
We conduct a large-scale training session every year, one for each inventory. Whenever possible, new personnel work in pairs with more experienced colleagues. We provide support from the office throughout the inventory to answer queries, review submitted data, and assist in solving any problems that may arise.
Data flow in the field
In the field, data is collected using three applications based on a modified version of ESRI’s Survey system. One application is used to store field photographs, another to manage the sharing of sample plots, and the third to register classes and variables. The collected data is transmitted via ESRI’s cloud service and continuously uploaded to a server at SLU, where it can be checked through the status portal.
Status Portal
This is the central hub for all information, which can be accessed from both the field and the office. Personnel receive their assigned tracts, plan their fieldwork and report their location. All collected data is available in portal and can be reviewed and corrected by both field staff and office personnel.
There are error controls built into the system. An example is that species observations are checked against the species portal's occurrences, which will indicate if the observation of a species is far from previous observations and therefore requires additional scrutiny.
A unique archive of landscape images
Up to 15 photos are recorded per sample plot. The directions are shown in figure 2. In addition, photos are also taken directly downward on the subplots and directly upward from the center point.
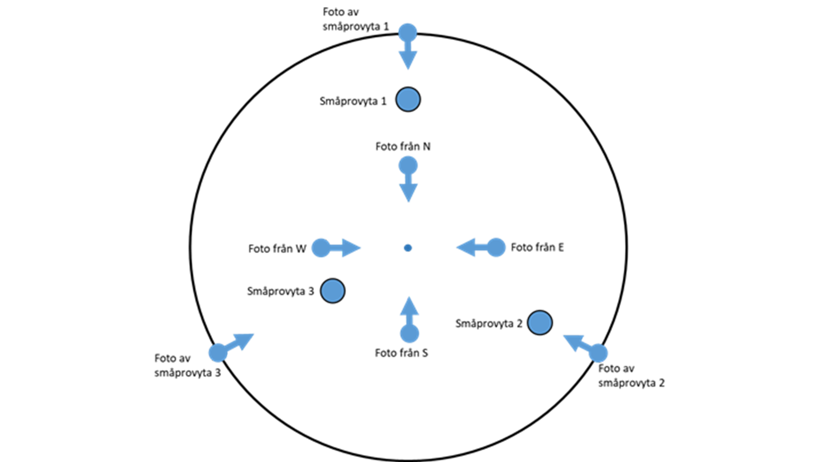
Figure 2. Illustration showing how the sample plot and sub-sample plot are photographed.
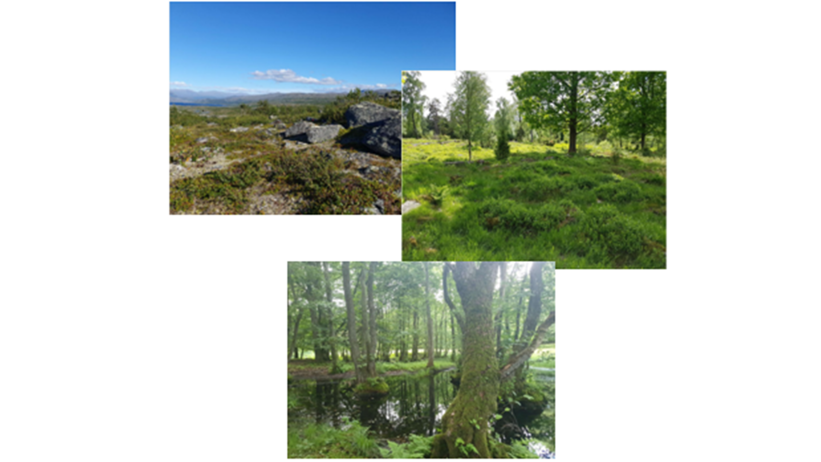
Figure 3. Examples of photographs taken at different sample plots.