GS-VMAS PhD Courses
Here you find information about all our upcoming PhD courses
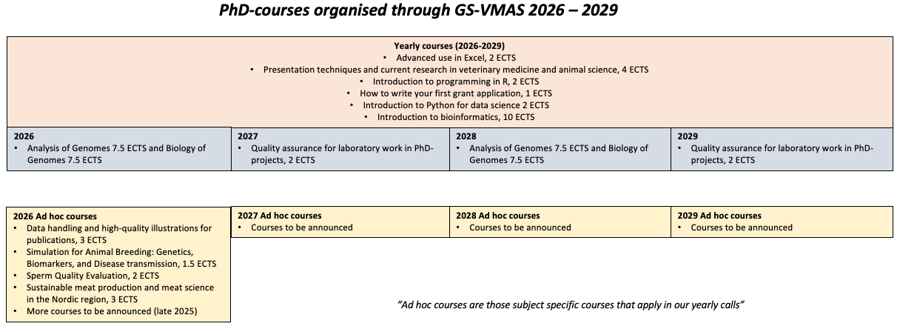
Recurring PhD courses 2026 - 2029
During 2026 - 2029 we will have a number of PhD courses that will be run on a regular basis (yearly and every second year) (to download). However, in addition to these we will also arrange a number of additional subject specific courses ("ad hoc") every year. Further information about all planned PhD courses can be found under "Upcoming PhD courses".
Upcoming PhD courses
Course code: PVG0044
Credits: 4
Course dates: Join continuously
The course has a dual format. One part is to actively participate in two workshops (4 hours per workshop) dealing with both oral and poster presentation techniques and the practical construction of a poster. Another part is to actively participate in >20 seminars given in the course seminar series. The seminar series will have weekly seminars during the spring and autumn semesters.
Course syllabus
Course code: PVG0024
Credits: 2
Course dates: 7 - 21 April 2025 (three physical meetings 7 April, 14 April and 21 April (digital attendence possible))
In the course, we will go through all menus in Excel and explain how to manage data by a variety of techniques. The students will have the opportunity to increase or reduce focus on different areas. Exercises will be the main form of learning and will be conducted outside the lecture room.
On completion of the course you will be able to:
- Process research data by use of Excel "functions"
- Assure data quality
- Produce figures and tables relevant to scientific publications
- Record basic "macros"
Course code: PVG0045
Credits: 2
Course dates: 20 - 24 April 2026
After attending this course you will be able to:
- Explain basic Python syntax
- Write simple functions in Python
- Transform data in various formats using the Pandas library
- Combine data sources stored in different files using the Pandas library
- Produce insightful summaries of datasets using the Pandas library
- Produce publication quality plots using the Seaborn library
Course code: P000043
Credits: 7,5 credits
Course date: 31 Aug - 1 Nov 2026 (can be read parallel with Analysis of genomes (P000042))
The course intends to provide advanced knowledge of theory and methods for studies of eukaryotic genomes, including their organization and evolution. There is a focus on animal genomics, but theoretical and methodological aspects of the course are applicable on many different organisms.
The course is based on lectures, exercises, and group discussions. The contents build largely on animal genome research. Theoretical teaching is for the most part directly applicable also within for example human or plant genetics. Genome science is rapidly evolving, and the course is based on current state-of-the-art methodology and research.
Computer exercises and group discussions will cover:
- structural and comparative genomics,
- molecular evolution and phylogenetics/-genomics,
- genomic diversity and genetic variation,
- functional genomics,
- gene mapping, GWAS, and QTL analysis,
- epigenetics/-genomics,
- genome editing and transgenic animals.
The aim of the computer exercises is to give the students useful tools for basic genetic and genomic analyses. Therefore, the computer exercises use free and open-source software that the student can download and use on their own laptop. In addition to the written and the oral examination, compulsory components occur within computer exercises and group assignments.
Course code: P000042
Credits: 7,5 credits
Course date: 31 Aug - 1 nov 2026 (can be read parallel with Biology of genomes (P000043))
The course intends to provide advanced knowledge of theory and methods for analysis of eukaryotic genomes, including their organization and evolution. There is a focus on animal genomics, but theoretical and methodological aspects of the course are applicable on many different organisms.
The course is based on lectures, group discussions, exercises, and wet laboratory. The contents build largely on animal genome research. Theoretical teaching is for the most part directly applicable also within for example human or plant genetics. Genome science is rapidly evolving, and the course is based on current state-of-the-art methodology and research.
A large part of the course involves wet laboratory training including exercises and a laboratory project.
Computer exercises and group discussions will cover:
- genome sequence variation,
- genome browsing,
- primer design,
- sequence analysis,
- high throughput sequencing methodology
The aim of the computer exercises is to give the students useful tools for basic genetic and genomic analyses. Therefore, the computer exercises use free and open-source software that the student can download and use on their own laptop. In addition to the written and the oral examination, compulsory components occur within eg. exercises, group assignments and laboratory sessions.
Course code: P000172
Credits: 1.5
Course dates: 21 Sept - 2 Oct 2026 (21–25 September: Hybrid teaching with lectures and exercises on campus and via Zoom. 1–2 October: Oral presentation of your own project on Zoom)
This PhD level course provides an in-depth exploration of simulation methods applied to key areas of animal science, animal breeding and genetics. Students will learn how to simulate and analyse different types of data, ranging from production and performance traits to molecular and epidemiological data, within animal populations. The course integrates core statistical frameworks — including linear models for both univariate and longitudinal observations — with advanced simulations of breeding programmes in species such as cattle, pigs, broilers and fish.
The course also considers the simulation of complex data structures, such as biomarkers and RNA-Seq datasets, and addresses the challenges of molecular phenotyping and multi-level data integration. The final module explores behavioural and epidemiological modelling, including the use of social network data and stochastic transmission models to simulate disease dynamics and interactions between individuals.
Throughout the course, students will engage with realistic scenarios and datasets, gaining hands-on experience of contemporary tools and approaches currently used and demanded in animal breeding research and industry
Course code: PVG0042
Credits: 3
Course dates: 21 - 23 September and 6 - 7 October 2026
The course will consist of a series of lectures, exercises and journal discussions. Two key issues related to questionnaire design and management as well as methods for evaluating and dealing with missing data. Multiple imputation to handle missing observations will be tackled.
After attending this course you will be able to:
- describe the principles of questionnaire design
- explain the psychology of respondent communication
- construct questionnaire studies and manage incoming data with high internal and external validity
- explain how missing observations arise in questionnaire studies and their impact on validity
- use multiple imputation methods to handle missing observations
Course code: PVS0151
Credits: 2
Course dates: 12 – 16 October 2026
The course covers the following fields: the concept of sperm quality, what it is and why it is needed in different situations; how it is evaluated from basic field laboratory to advanced research setting; how it is used for different species; pitfalls in sperm quality evaluation; how it can be improved in the future. There will be a series of tutor-led lectures, workshops and practical sessions.
Course code: PVS0141
Credits: 10
Course dates: 2 Nov 2026 - 17 Jan 2027
The course aims to give the student a solid foundation in the basic methods of bioinformatics. It will cover the theories, algorithms and practical applications of computer-based methods for analysis of DNA sequences and protein structures. The topics to be covered include: - biological databases - homology analysis - sequence analysis (with emphasis on the package EMBOSS and UGENE) - statistics and R introduction - web-based tools for analysis - the Unix operating system - phylogeny - comparative genomics - functional genomics - Next Generation Sequencing (NGS).
These are courses planned for 2026, but their start dates have not yet been determined. We will update the website with confirmed dates as soon as they are available.
- Reproducible Research (Prelim. dates 31 Aug - 18 Sept)
- The infection biology, ecology and One Health perspective of vector- and reservoir-borne infectious diseases
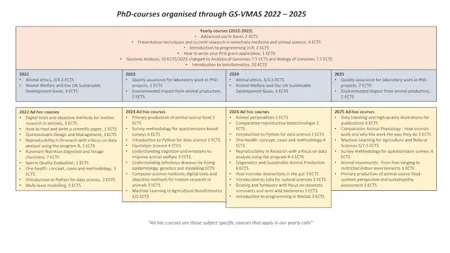
Previous PhD Courses (2022 - 2025)
Contact
-
Graduate School for Veterinary Medicine and Animal Science (GS-VMAS)