Pesticides in surface water
Which pesticides are found in the four catchment areas and in the two rivers in Skåne? Which pesticides are found in concentrations above their Water Quality Objectives (WQO) and may pose a problem for aquatic organisms?
Herbicides commonly found in monitored watercourses
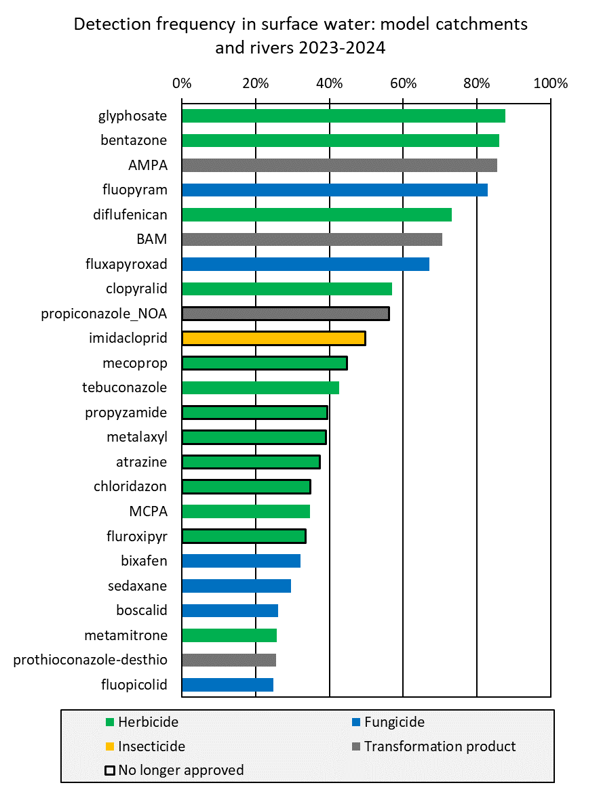
The substances most frequently detected in the four representative catchments and in the two rivers in Skåne during 2023 and 2024 are summarized in Figure 1. Herbicides are the most common type of substances, including both approved substances and some whose approval was recently withdrawn (e.g. propyzamide, April 2023) or that have been banned for many years (e.g. atrazine, since the 1990s). In the surface water samples, several fungicides and a few insecticides were also found.
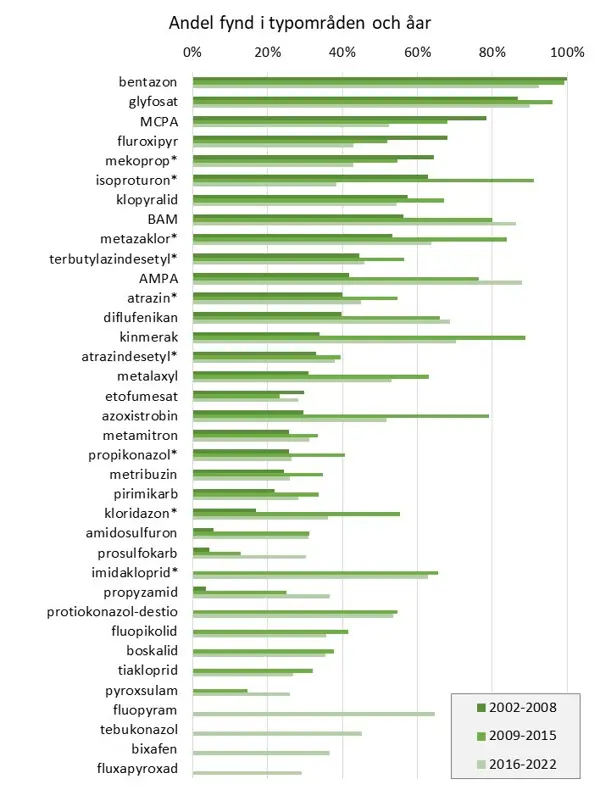
All plant protection products eventually degrade into other substances, which are here referred to as transformation products. Some of these, such as BAM, are more persistent and take longer to break down, and therefore also need to be monitored. Changes in detection frequency for the most common substances from 2002 onward can be seen in Figure 2.
The detection of a plant protection product in surface water samples does not necessarily mean it poses a direct or acute threat to aquatic organisms. For this reason, Water Quality Objectives (WQO) values are used to assess whether concentrations are toxic – see more information on the page "Water quality objectives for pesticides in surface Water".
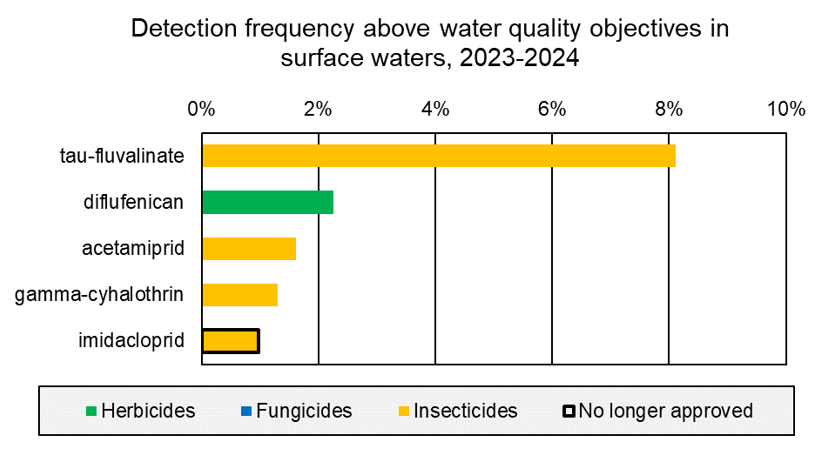
In the 310 surface water samples collected from the representative catchments and rivers during 2023–2024, a total of 110 out of approximately 160 analyzed substances were detected. Of these, nine were found at concentrations above the WQO for each substance. Five substances were detected more than once above their respective WQO, and the detection frequency of these is shown in Figure 3. Of these, all were approved for use as plant protection products during the period, except for imidacloprid, which was banned in 2018.
Many insecticides are rarely encountered but are toxic even at low concentrations
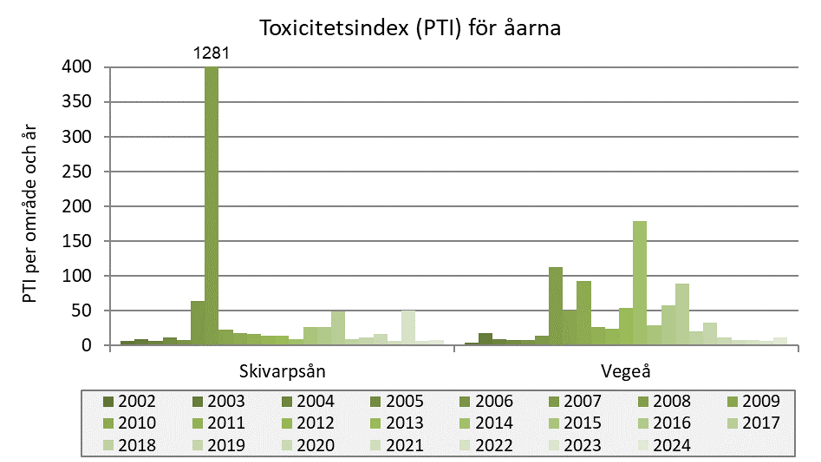
Pesticide Toxicity Index for the catchment and rivers
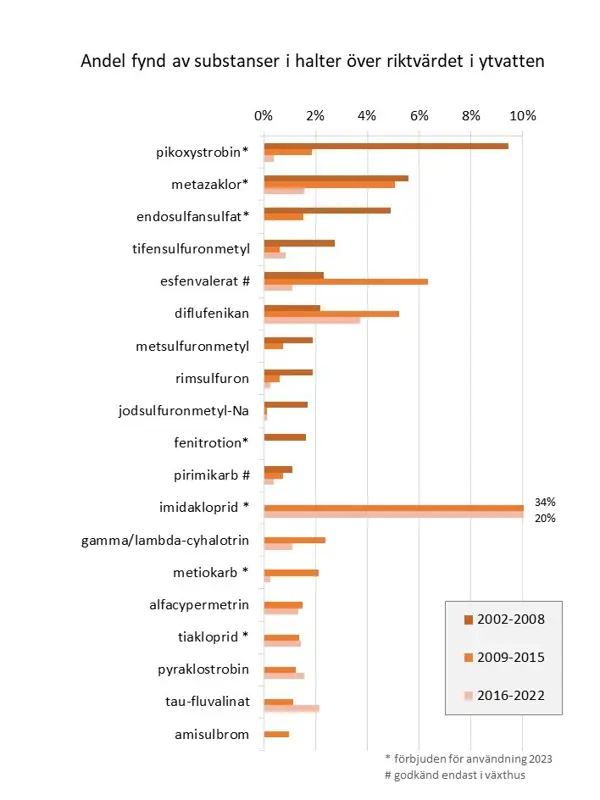
The figures below show the pesticide toxicity index (PTI), calculated using all analyzed substances for the catchment areas and the two rivers in Skåne during 2002–2024. The calculations are based on water quality objectives valid as of October 2025, and the figures may differ slightly from earlier versions. The current water quality objectives can be found on the page “Water quality objectives for pesticides in surface water.”
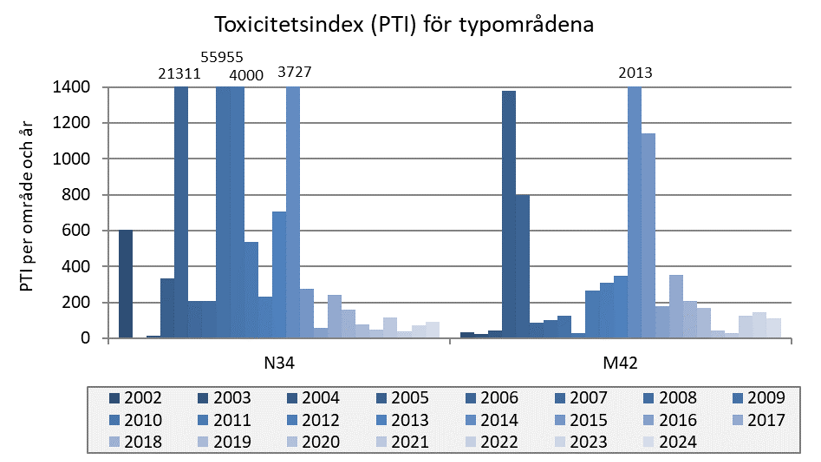
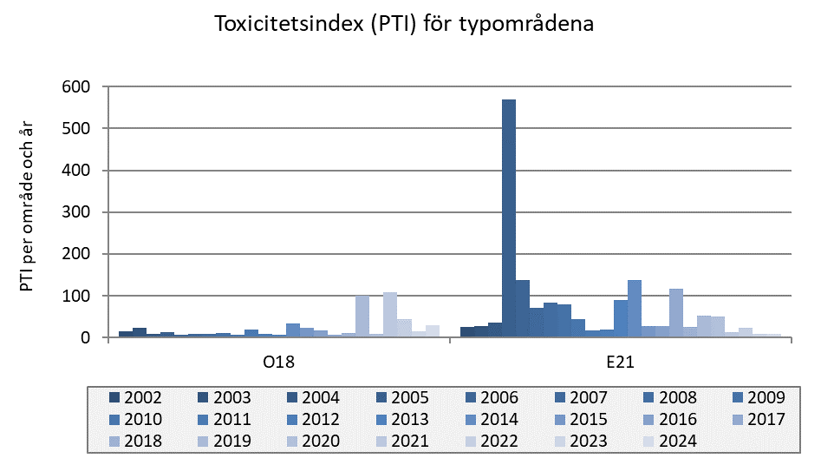
The toxicity index from the catchment areas is used to calculate the environmental objective indicator for a “Non-toxic Environment,” sub-goal “Toxicity index for plant protection products in surface water” (In swedish).