Annually, the farmers using fields within the catchments included in the monitoring program are interviewed regarding crops and pesticides used. This information serves as guidance for which substances to include in the analyses and enables comparisons between detected concentrations in surface water and usage.
Use of pesticides
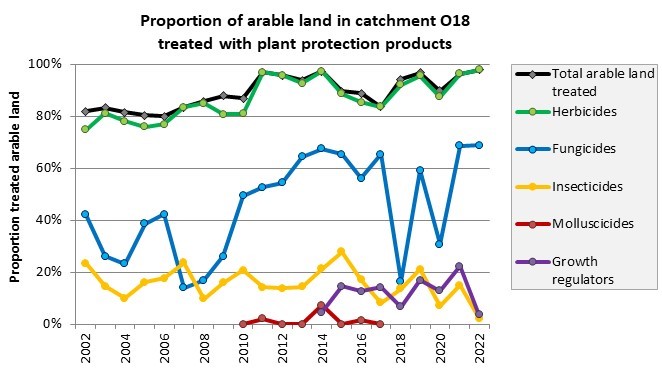
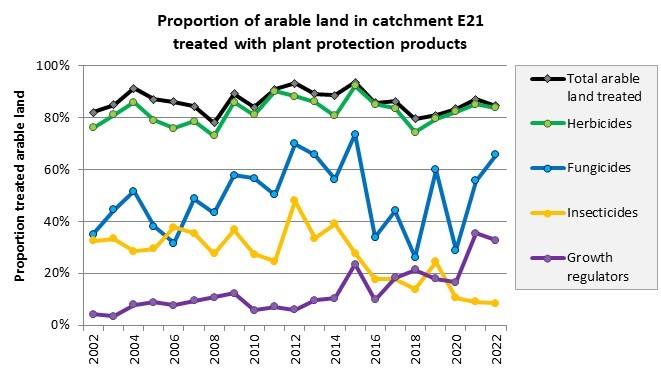
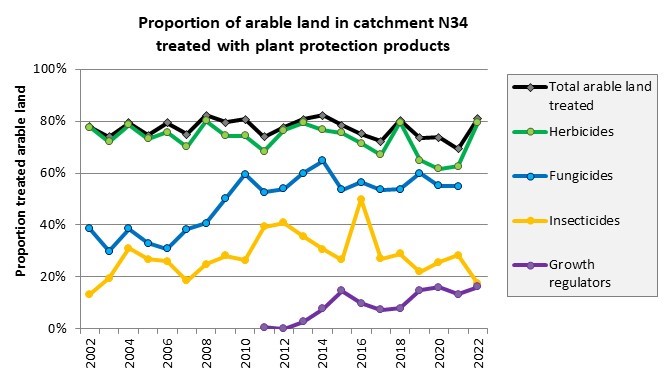
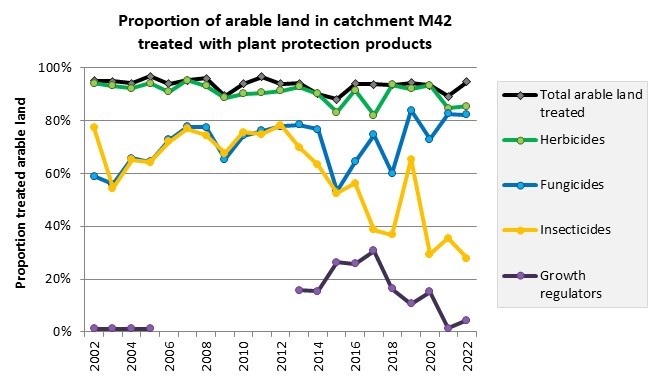
In the model catchments of Halland (N34) and Skåne (M42) counties there has been a greater use of pesticides throughout the period 2002-2022 than in the two more northern model catchments of Västergötland (O18) and Östergötland (E21) counties. This can partly be explained by a longer growing season in the southern counties, but also partly other crops and to a certain extent a greater need for pest control. Overall, the annual variation, mainly in M42 and N34, in terms of the amount of plant protection product used per hectare, makes it difficult to see any trend.
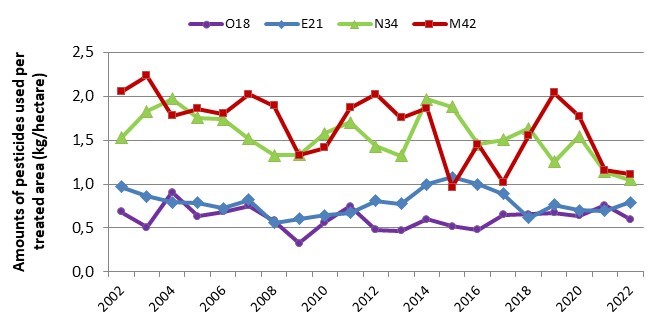
Figure showing amounts of pesticides used per treated area, given as kg per hectare, in four Swedish model catchments, 2002-2022.
Crops
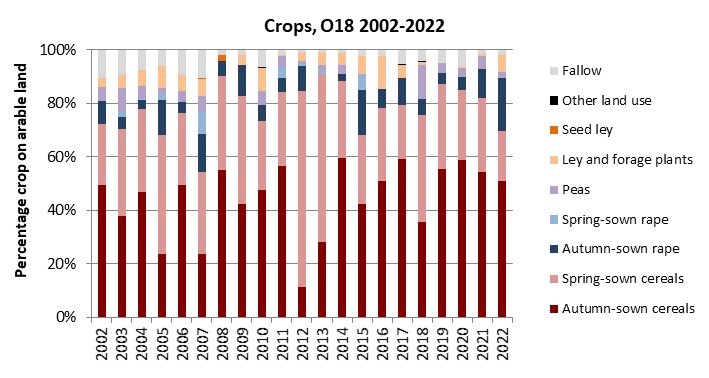
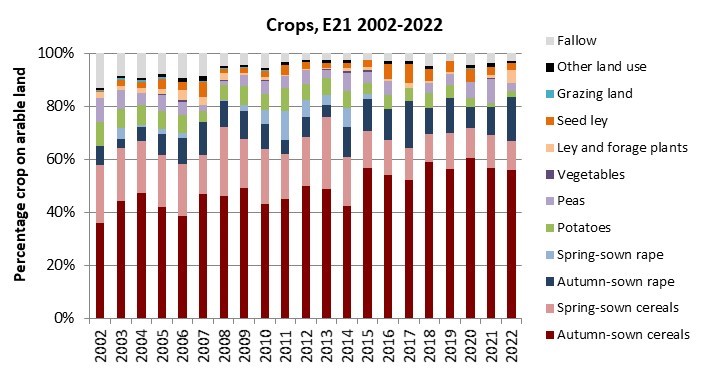
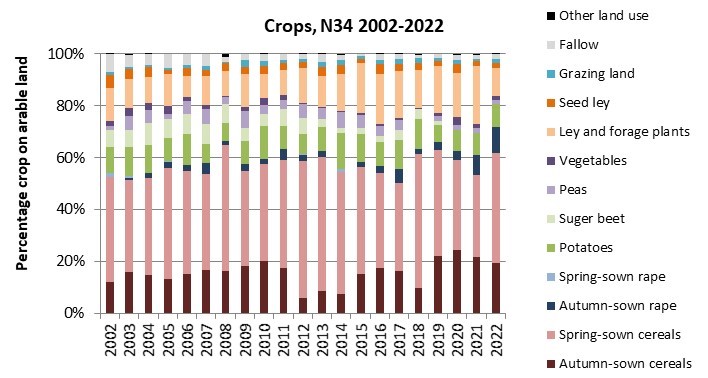
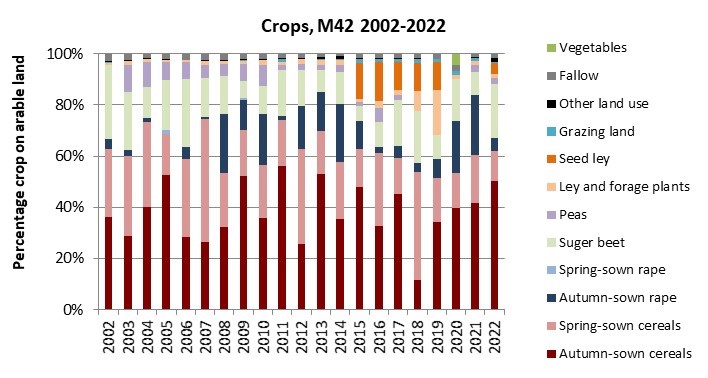
The four model catchments are dominated by cereals but have slightly different focuses when it comes to other types of crops. The model catchments in Västra Götaland (O18) is mainly dominated by cereals. Oilseeds are grown more or less in all model catchments, and have gone from being mainly winter sown to solemnly being winter sown from 2016. Potatoes are grown in both Halland's (N34) and Östergötland's (E21) model catchments, while sugar beets are mainly grown in Skåne's model catchments (M42 ). The category “forage” includes grass and clover forage crops and seed cultivation of these, but also maize and legumes for fodder production and peas, which in some cases are stated as "canned", ie for food. This category is largest in Halland's (N34) model catchment and consists mainly of forage production.
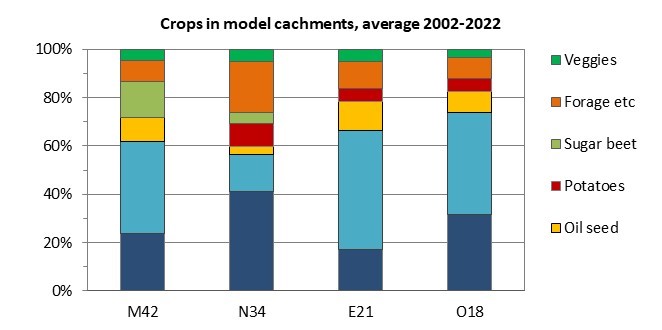
Figure showing average land use per crop in four model catchments, 2002-2022.
Below is crop type per year and model catchment as well as proportion of arable land treated with different types of plant protection products (CLICK on header below!).