Pesticides in surface waters

Last changed: 29 September 2023
Stream in backlight. Photo.

Find out which pesticides we find in the streams of the model catchments, and the two rivers in Skane county. See which pesticides are found above water quality objectives and can be considered a problem to water living organisms. Explore the time trend of pesticide toxicity index från 2002 til today.

Which pesticides are found in surface waters?

Bentazone and glyphosphate are the two plant protection products found most frequently over the years, in the four streams of the model catchments and the two rivers. However, the frequency of findings of glyphosphate have declined the last few years (compare the finging frequency figures below). At the same time the metabolite of diclobenile (not approved for use for a long time) and fluopicolide (approved for use), BAM, have increased in frequency of findings with time.


Number of analysed substances

Since 2002, the number of substances included in the analyses of surface water has increased from approximately 80 to 150 per sample (Figure 1). At the same time the development of new methods and better instruments have made it possible to measure at even lower concentrations, most notably seen from 2009 and onwards. This means that an increase in the number of substances found in some cases is an effect of the increased possibility of detecting substances, and does not necessarily mean that the number of substances found in the samples has actually increased.

Of the analysed substances herbicides are the main group, followed by fungicides, insecticides and transformation products. Since 2009, one or two growth regulators have also been included in the analyses.

All analyses of pesticides are carried out by the organic environmental chemistry laboratory, at the department of aquatic sciences and assessment, the Swedish University of Agricultural Sciences (SLU). The analytical methods are accredited by SWEDAC and the laboratory regularly participates in international intercalibrations. The laboratory is also accredited to report so-called trace levels (levels below the quantification limit but above the detection limit) and therefore these are included when the results are reported.

number of analysed substances 2002-2022

method development with detection limits 2002-2022


Figure 1. Number of analysed pesticides (a) and median of detection limits per pesticide group (b), in surface and ground water of the Swedish national monitoring program of pesticides, 2002-2022.

Findings in surface waters 2002-2008

Findings of pesticides in surface waters 2002-2008

Figure 2. Findings of pesticides in surface water samples (from model catchments and rivers), during sampling May - October 2002-2008. Substances with a detection frequency of 25% or more are presented.

Findings in surface waters 2009-2015


Findings of pesticdes in surface waters 2008-2015

Figure 3. Findings of pesticides in surface water samples (from model catchments and rivers), during sampling May - October 2009-2015. Substances with a detection frequency of 25% or more are presented.

Findings in surface waters 2016-2020

findings in surface water 2016-2022

Figure 4. Findings of pesticides in surface water samples (from model catchments and rivers), during sampling May - October 2016-2022. Substances with a detection frequency of 25% or more are presented.

Summed concentrations in rivers and catchments

Summed concentrations of pesticides in catchments 2002-2022

Summed concentrations of pesticides in model catchments 2002-2022

Nuber of uniqe substances found in concentrations above WQO

EN_Antal substanser över riktvärdet, per år tom 2022.jpg

EN_Andel ytvattenprover med riktvärdesöverstigande 2002-2022.jpg

Pesticiy toxicity index for model catchments

PTI typområden alla subst 2002-2020.png

Pesticide toxicity index in two rivers

PTI åarna alla subst 2002-2020.png

Raw data

Time integrated (weekly composite) samples are collected in the model catchments and grab samples are collected from two monitoring rivers. In the model catchment of Skåne there is also an automatic sampler taking flow proportional samples.

The data-host webpage "Jordbruksvatten" (=agricultural water) also contains a link to a separate database where data for daily average discharge within the model catchment streams is compiled.

Time integrated and grab samples

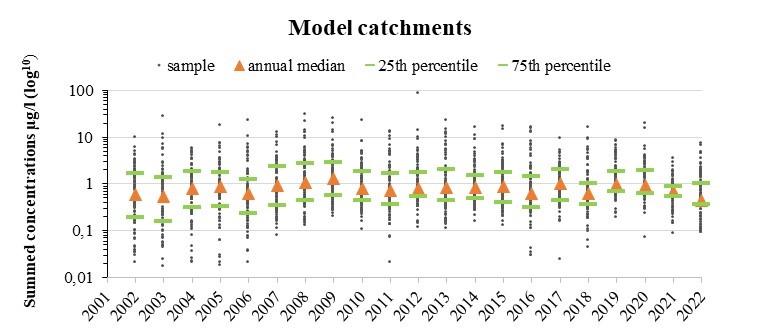
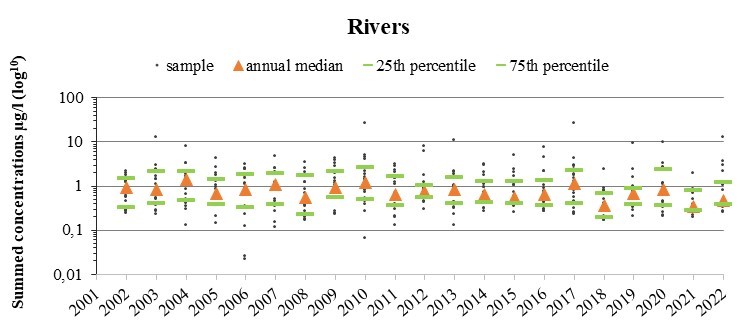
Each of the time integrated samples taken within the model catchments  contain approximately 100 subsamples automatically sampled every 90 minutes during a week. Between 20-30 weekly samples are collected from each model catchment every year during the growing season, May - November. Grab samples from the two rivers Skivarpsån and Vege å (both in the county of Skåne) are collected by hand every second week in May-June and once a month in July-November (9 samples per river per year).

The database and the data host webpages are currently only available in Swedish, but a description of how to get the data from the pesticide monitoring program and the hydrographs is described below. A translation key for the data headers and other important information is available for download here.

Guide to downloading the data:

Click the link above to get to the data host page "Jordbruksvatten" (=agricultural water). Click on the header "Växtskyddsmedel (bekämpningsmedel) i ytvatten" (=Plant protection products (pesticides) in surface water, 3rd option in the list) and then on “Analysvärden” (=analytical values) to obtain data for all areas. Alternatively, you can select one or more specific sampling locations, substances, or years from the dropdown menus (hold the Ctrl key to select more than one option from each menu). The four model catchments are: Skåne (M42), Halland (N34), Västra Götaland (O18) and Östergötland (E21) and the two rivers: Skivarpsån and Vege å in Skåne. After making your selection, click on “Analysvärden” (=analytical values) to access the download page. Enter your name (“Namn”), organization (“Organisation”), and the purpose (“Syfte”) for downloading the data. Click on “Hämta data” (=get data). This information is collected for statistical purposes to illustrate how the data is being used.

To obtain data for the daily average water discharge for the model catchment streams, go to the data host page and click on the header "Växtnäring i ytvatten" (=”Plant nutrients in surface water, 1st option in the list) and select the model catchment you are interested in (Note! There are more model catchments here than for the pesticide monitoring program because plant nutrients are analyzed in more streams). Click on “Sök” (=Search) to get to the data for the specified catchment. Check the box for the catchment and click on ”Vattenföring” (=discharge) to get to the download page. Enter your name (“Namn”), organization (“Organisation”), and the purpose (“Syfte”) for downloading the data. Click on “Hämta data” (=get data).

Flow proportional surface water sampling

In addition to the time integrated sampling in Skåne model catchment, there is an automatic sampler taking flow proportional samples of surface water. These samples enable studies of variations in the concentrations of substances during changes in water flow.

Data can be downloaded here (Excel-file).

Water Quality Objectives

To enable evaluations of the concentrations found in the surface water, they are compared to water quality objectives (WQO) for each substance.

The WQOs used in the Swedish pesticide monitoring program can be downloaded here (Excel file "Sammanställning av de aktuella riktvärdena som används inom den svenska miljöövervakningen av bekämpningsmedel version 2023:1, last updated 18 August 2023).

References to the WQOs are Swedish Agency for Marine and Water Management (HVMFS 2019:25) and Swedish Chemicals Agency. Some substances analyzed within the monitoring program do not have official WQOs and therefore preliminary WQO values have been calculated (Andersson et. al 2009 and Andersson & Kreuger 2011).

For more information, please see the Swedish version of this page.